Introduction
In this article, we present a unit test study aimed at verification 3D-CSFM of concrete anchor pull-out behavior through a direct comparison with experimental results[1]. The focus of our investigation lies in evaluating the predictive capabilities of numerical models in capturing the key aspects of anchor behavior, including failure modes, and ultimate capacity. Our study encompasses a diverse range of anchor diameters, from 10mm up to 32mm reflecting the variability encountered in practical engineering scenarios. Allowing us to discern any diameter-dependent trends and assess the robustness of 3D-CSFM across different scales. It is noteworthy to mention that all simulations are conducted within 3D-CSFM, a method implemented in IDEA StatiCa Detail, utilizing default settings for all parameters.
Definition of failure modes
To evaluate the 3D-CSFM's performance in modeling post-installed bonded anchors, we must consider two failure modes: pull-out, where the bond stress (τb) is equal to design bond stress (τbd), and yielding of the anchor itself, meaning limit plastic strain is reached.
Unit test set up
In this study, Hilti HIT-RE500 - SD Injectable Mortar with Reinforcement (500B) anchors were modelled in IDEA StatiCa Detail and the results compared with the experimental data[1].
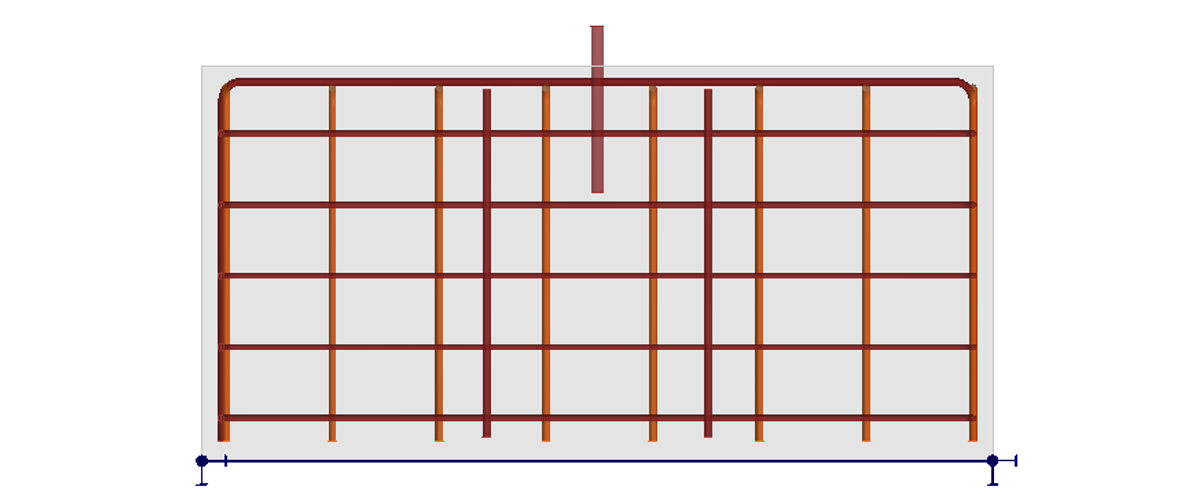
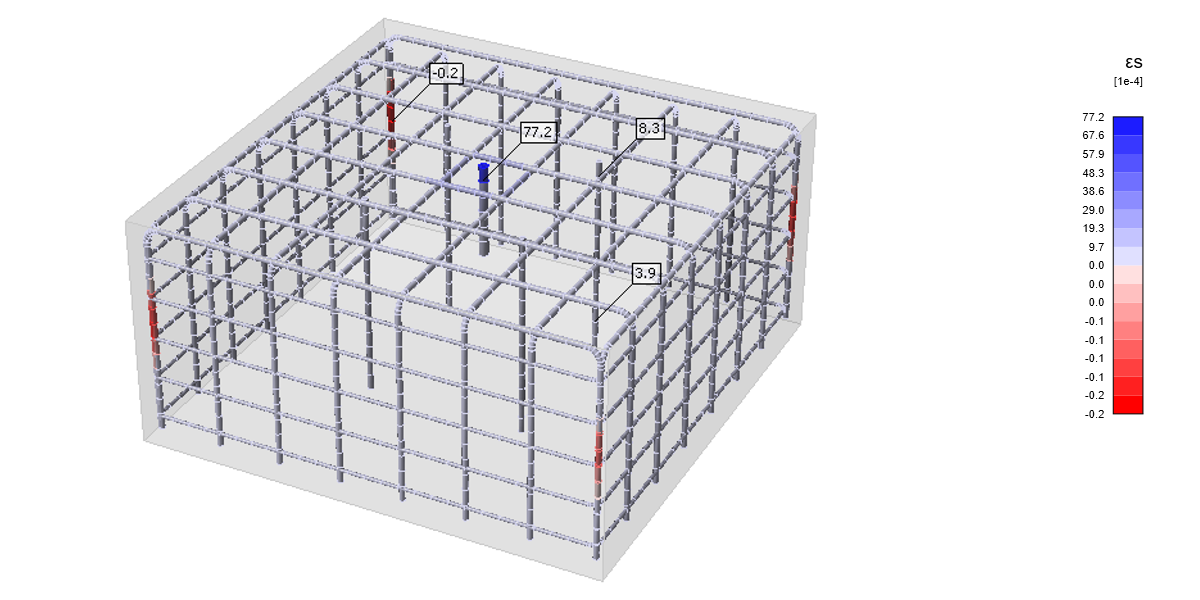
The dimensions of the concrete blocks and their reinforcement were carefully considered to mitigate any potential effect on pullout behavior, thus ensuring the validity of the experimental results[1]. One concrete block size was used for all anchor unit tests (1.0x1.0x0.5 m; WxDxH). The block is reinforced by bars of steel B 500B and diameter of 8-14 mm. 8 layers of bars around each surface (except for bottom surface, rebars are modeled as continuous through the bottom support) with distance layer of 135.0 mm. All safety factors prescribed by relevant building codes were rigorously adhered to, with a setting of 1.0 employed throughout the calculations. The size of the anchor hole compared to the diameter of the anchor itself was not explicitly considered in the calculation model.
\[ \textsf{\textit{\footnotesize{Fig. 1.1 Side view of a reinforced concrete block with glued in anchor}}}\]
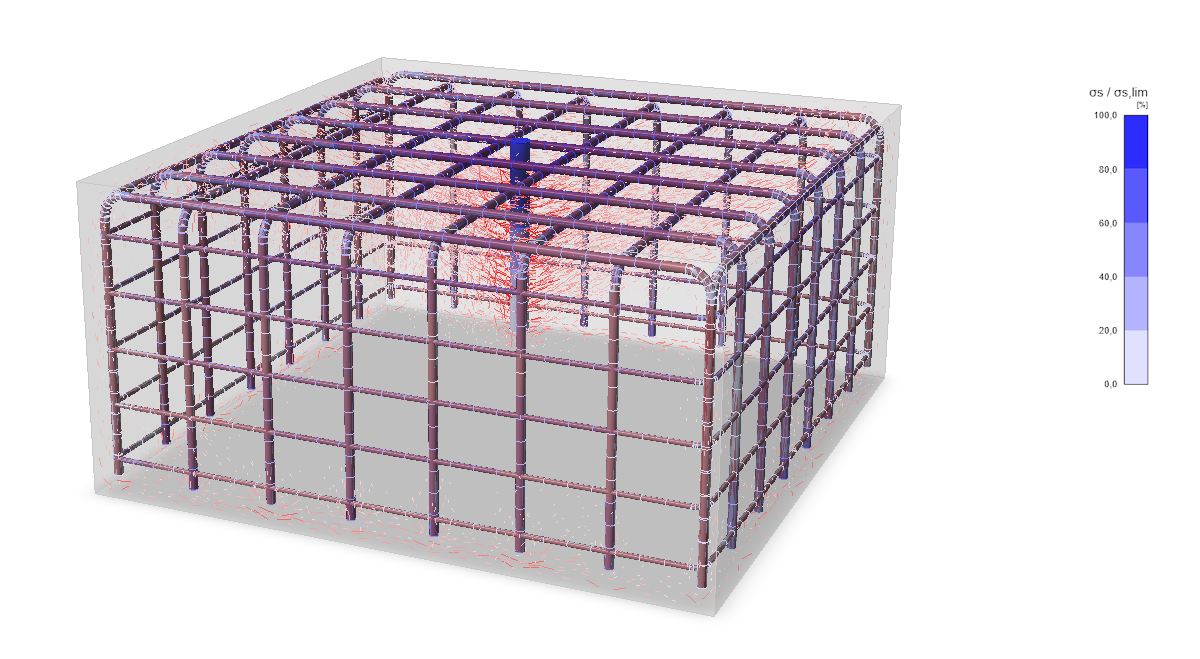
\[ \textsf{\textit{\footnotesize{Fig. 1.2 View of a reinforced concrete block with highligted anchor. Diameter of anchor equals to 16 mm }}}\]
The anchor bond strength, a critical parameter in anchorage design, was determined to be 15.4 MPa according to experiments consideration[1], and 12.0 MPa for the second verifying model. Similarly, according to the experiment, the length of the anchor embedment in the concrete block was consistently determined. The additional 50 mm length of the anchor above the concrete block to which the axial tensile force was applied were considered in the model. In this test, anchors with a diameter of 10mm, 12mm, 16mm, 20mm, 25mm, 32mm were compared with experimental results. Experimental set ups summarized in Table 2.2.
Utilizing a 3D-CSFM Solid Block model, the analysis encompasses a comprehensive examination of various aspects including anchor pull-out characteristics, determination of critical load thresholds, and nuanced prediction of failure modes.
Material properties
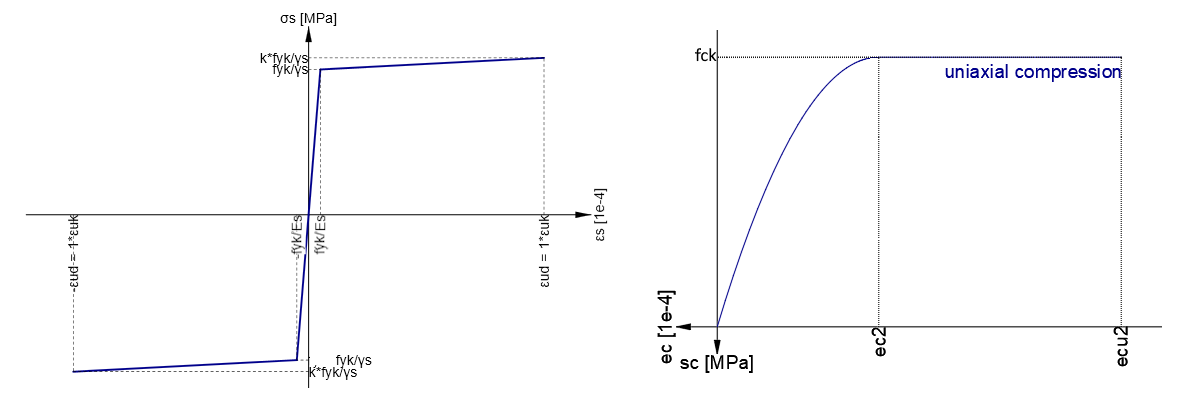
The material properties of the concrete, reinforcement, and anchor used in the CSFM analysis are summarized in Table 2.2. The yield stress (\(f_{yk}\)) and the ultimate stress (\(k \times f_{yk}\)) of the reinforcement, as well as the compressive strength (\(f_{ck}\)), plastic strain (\(\epsilon_{c2}\)), and limit plastic strain (\(\epsilon_{cu2}\)) of the concrete, were selected based on the conditions noted in the experiment remarks. The Bond Strength is also specified by the manufacturer in the provided prospectus.
\[ \textsf{\textit{\footnotesize{Fig. 1.3 Stress strain diagrams of materials: (a) Stress-strain diagram of reinforcement B 500B, (b) Stress-strain diagram of concrete C30/37 }}}\]
Comparison with experimental results
This section compares experimental results from the manufacturer with the ultimate loads and failure modes predicted by the 3D-CSFM. Six instances of ultimate pull-out load, corresponding to various anchor diameters, were matched against outcomes from the 3D-CSFM. Additionally, a specific failure mode was determined for each anchor diameter.
Failure modes and ultimate loads
Table 2.4 presents a comprehensive summary of the ultimate loads recorded in experimental tests (Pu,exp) and those predicted by the 3D-CSFM (Pu,3D-CSFM), along with the corresponding failure modes. Ratios exceeding one indicate that the model's predictions are conservatively higher than the measured values. As evidenced in Table 2.4, the primary failure modes predicted by all 3D-CSFM analyses are consistent with the experimental findings, although some discrepancies in specific failure subtypes are noted for larger diameters. The 3D-CSFM predictions are generally accurate, with slightly conservative tendencies indicated by ratios greater than 100% for the larger diameters.
Additionally values of (\(P_{u,bar}\)) and (\(P_{u,bond}\)) were calculated and added to the table.
\(P_{u,bar}=A_{bar}\cdot k \cdot f_{yk}\)
\(P_{u,bond}=C_{bar}\cdot l_{bar} \cdot \tau_{bd}\)
Where (\(A_{bar}\)) is an area of the anchor, (\(C_{bar}\)) is the circumference of the anchor, and (\(l_{bar}\)) is a length of the anchor in the concrete.
It can be seen, from the values presented above, that the experiment is set to prove that the solver is able to correctly calculate combined Pull-out and YA failure mods.
In addition, the same models with the bond strength of (\(\tau_{bd} = 12.0 MPa\)) were calculated and compared with analytically determined values of (\(P_{u,bond}\)).
Figure 1.4 corroborates the outcomes indicated in Table 2.4 by showing that the full capacity of bond stress is achieved as well as limit strain, which consequently leads to the failure mode being identified as Pull-out and YA.
\[ \textsf{\textit{\footnotesize{Fig. 1.4 Anchor 16 mm: Strain check value (left) and Bond stress (right) }}}\]
\[ \textsf{\textit{\footnotesize{Fig. 1.5 Anchor 32 mm: Stress flow view }}}\]
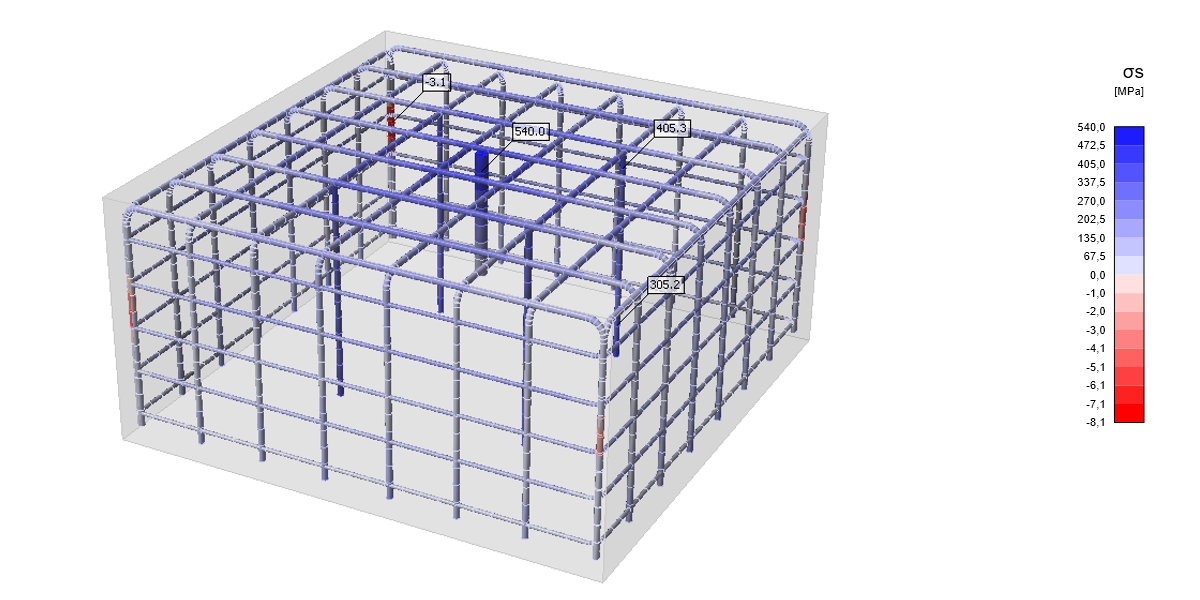
\[ \textsf{\textit{\footnotesize{Fig. 1.6 Anchor 25 mm: Stress in the reinforcement }}}\]
\[ \textsf{\textit{\footnotesize{Fig. 1.7 Anchor 20 mm: Strain in the reinforcement }}}\]
Conclusion
The comparison between experimental data[1] and the beta version of the 3D-CSFM indicates a satisfactory correlation. Key insights from this preliminary evaluation include:
- A strong correlation has been established for all anchors, evident in the failure modes observed in models and the values of ultimate loads.
- Although the 3D-CSFM is still in its beta phase, its alignment with experimental findings highlights its potential utility. This agreement provides some validation of the tool's effectiveness, though it should be interpreted with caution given its developmental stage.
References
[1] - HILTI. Hilti HIT - RE500 - SD Injectable Mortar with Rebar (500B). HILTI CORPORATION. Https://www.hilti.com.hk/ [online]. 2016 [cit. 2024-04-22]. Available from: https://www.hilti.com.hk/medias/sys_master/documents/h86/h89/9485674512414/Submittal-ASSET-DOC-LOC-8336225.pdf


