Column base – Hollow section column (EN)
Description
The component-based finite element method (CBFEM) for the hollow section column base verified to the component method (CM) is described below. A compressed column is designed as at least class 3 cross-section. The sensitivity study is prepared for the size of the column, the dimension of the base plate, concrete grade, and the dimension of the concrete block. Four components are activated: the column flange and web in compression, the concrete in compression including grout, the anchor bolt in tension, and welds. This study is mainly focused on two components: concrete in compression including grout and anchor bolt in tension.
Fig. 8.4.1 Significant points of multilinear interaction diagram of square hollow section
Verification of resistance
In the following example, the column from square hollow section SHS 150×16 is connected to the concrete block with the area dimensions a' = 750 mm, b' = 750 mm and height h = 800 mm from concrete grade C20/25 by the base plate a = 350 mm, b = 350 mm, t = 20 mm from steel grade S420. Anchor bolts are designed 4 × M20, As = 245 mm2 with a head diameter a = 60 mm from steel grade 8.8 with the offsets at the top 50 mm and the left −20 mm and with an embedment depth 300 mm. Grout has a thickness of 30 mm.
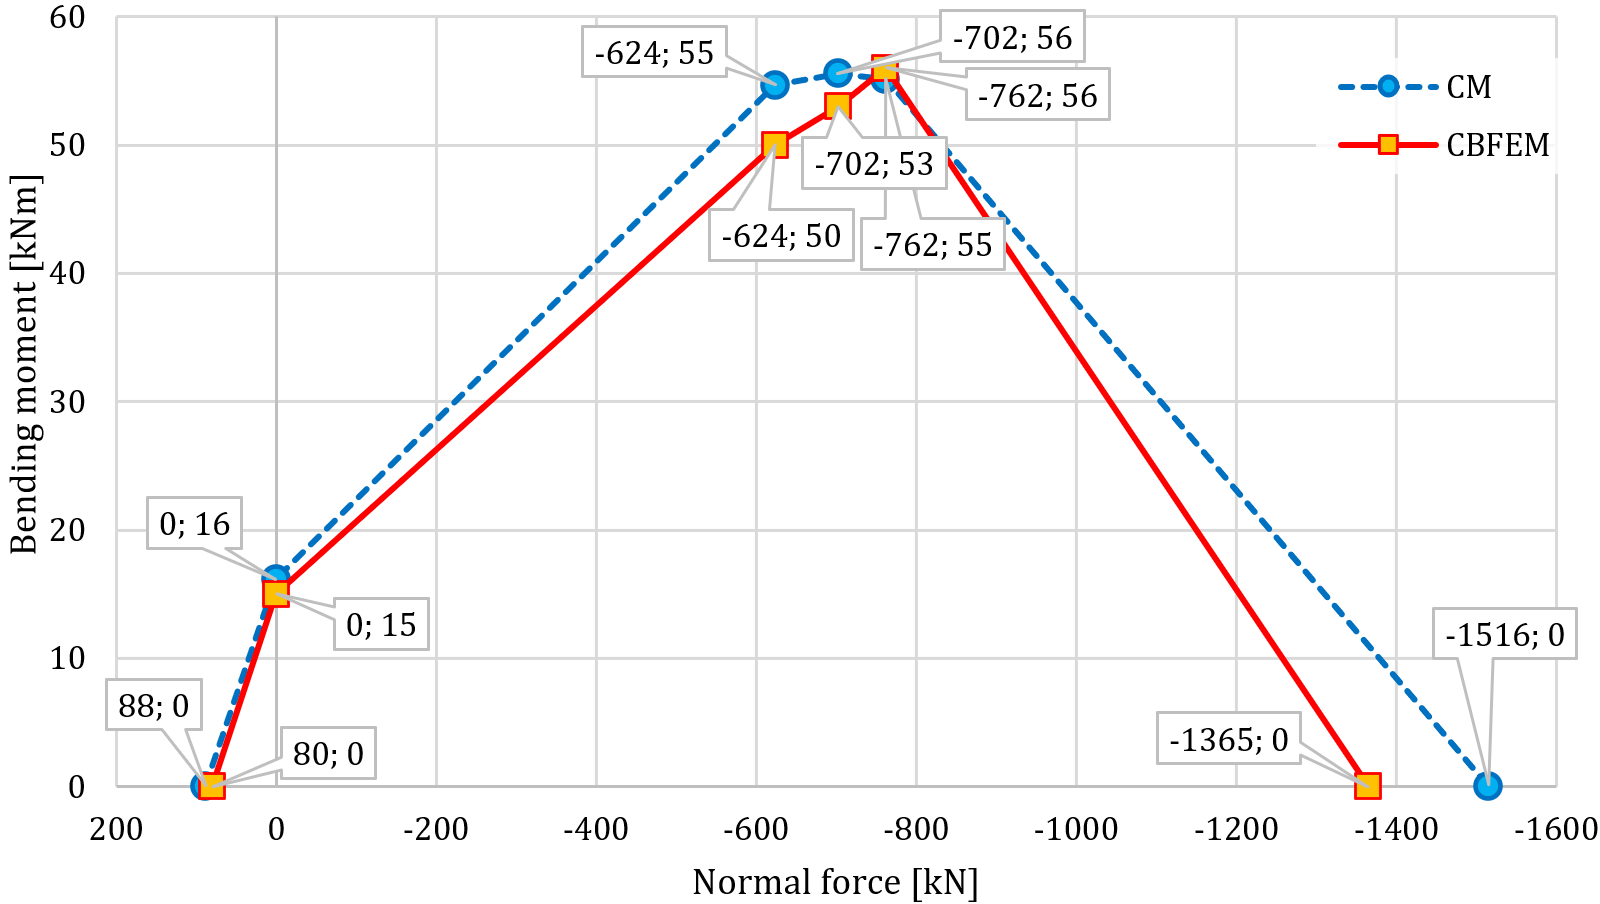
The results of the analytical solution are presented as an interaction diagram with distinctive points. A detailed description of points −1, 0, 1, 2, and 3 is shown in Fig. 8.4.1; see (Wald, 1995) and (Wald et al. 2008), where point −1 represents pure tensile force, point 0 pure bending moment, points 1 to 3 combined compressive force and bending moment, and point 4 pure compressive force.
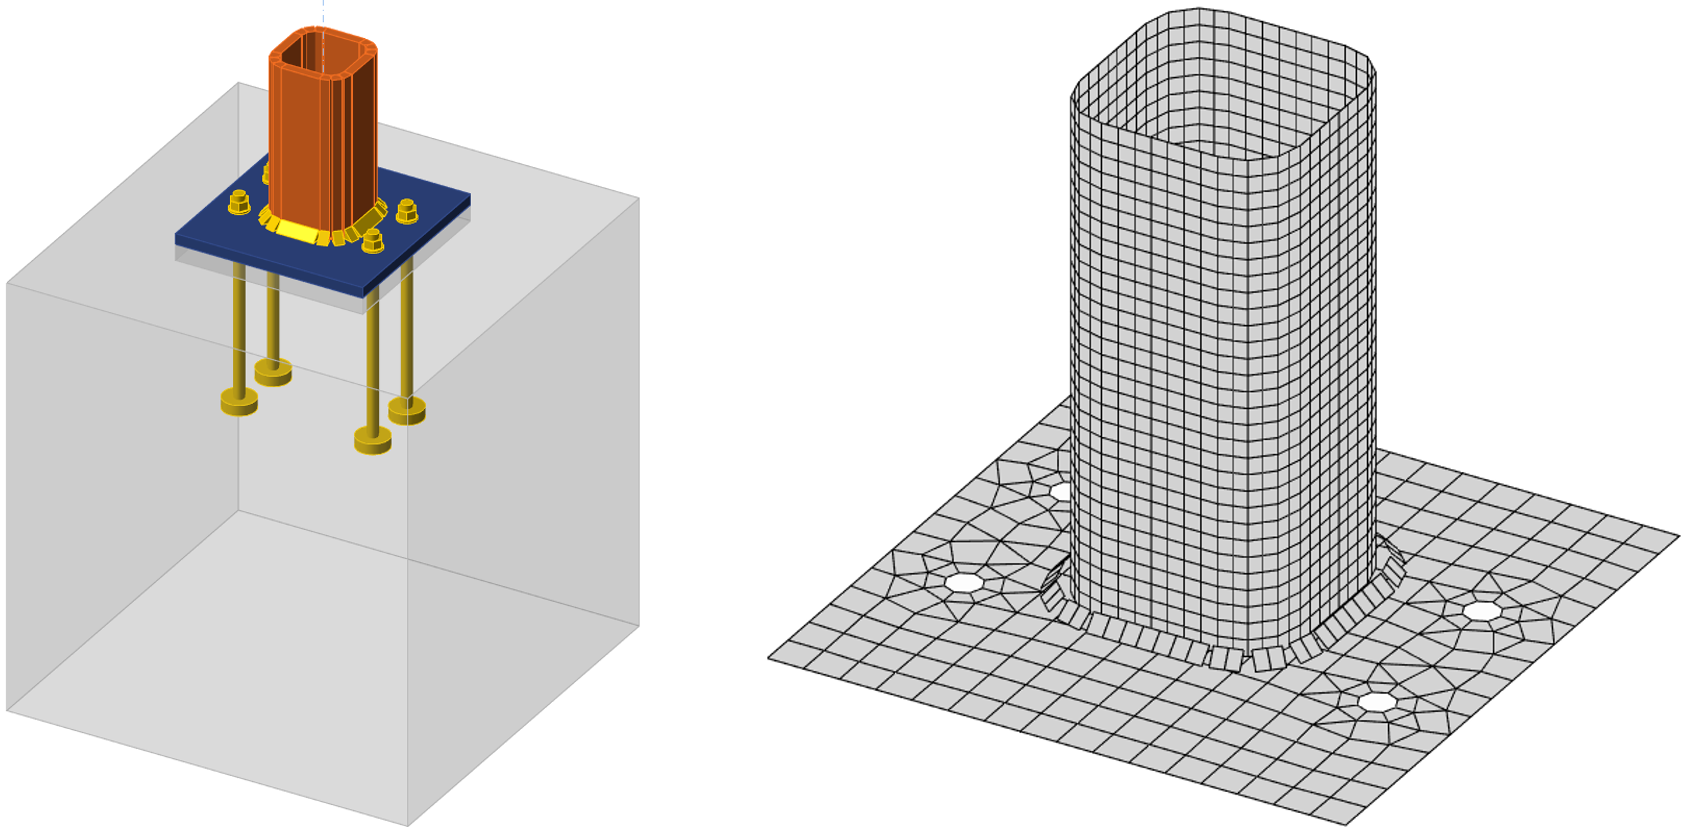
Fig.8.4.2 The column base for column SHS 150×16 and selected mesh of the base plate
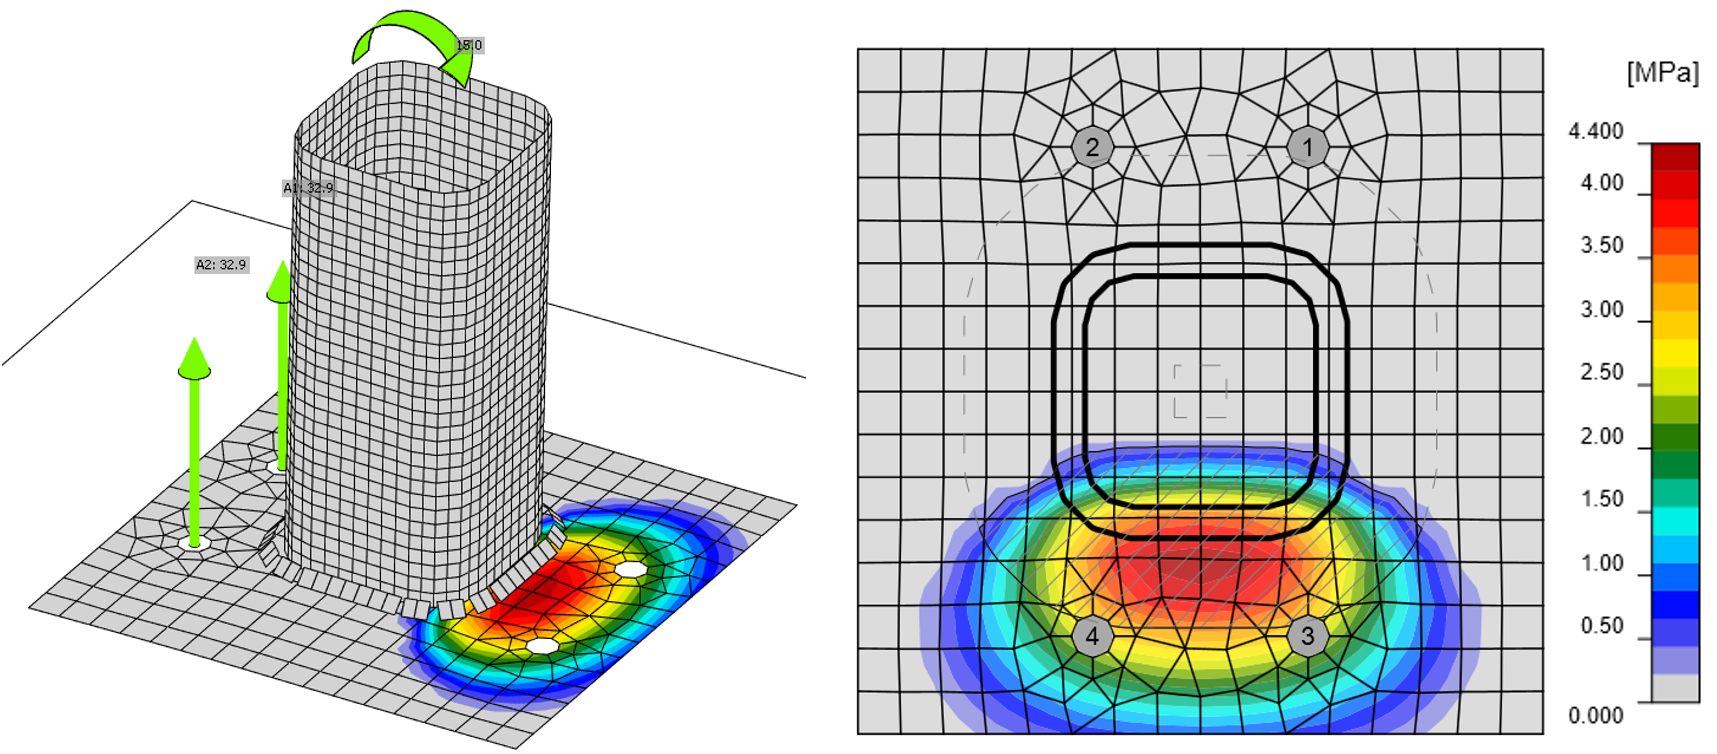
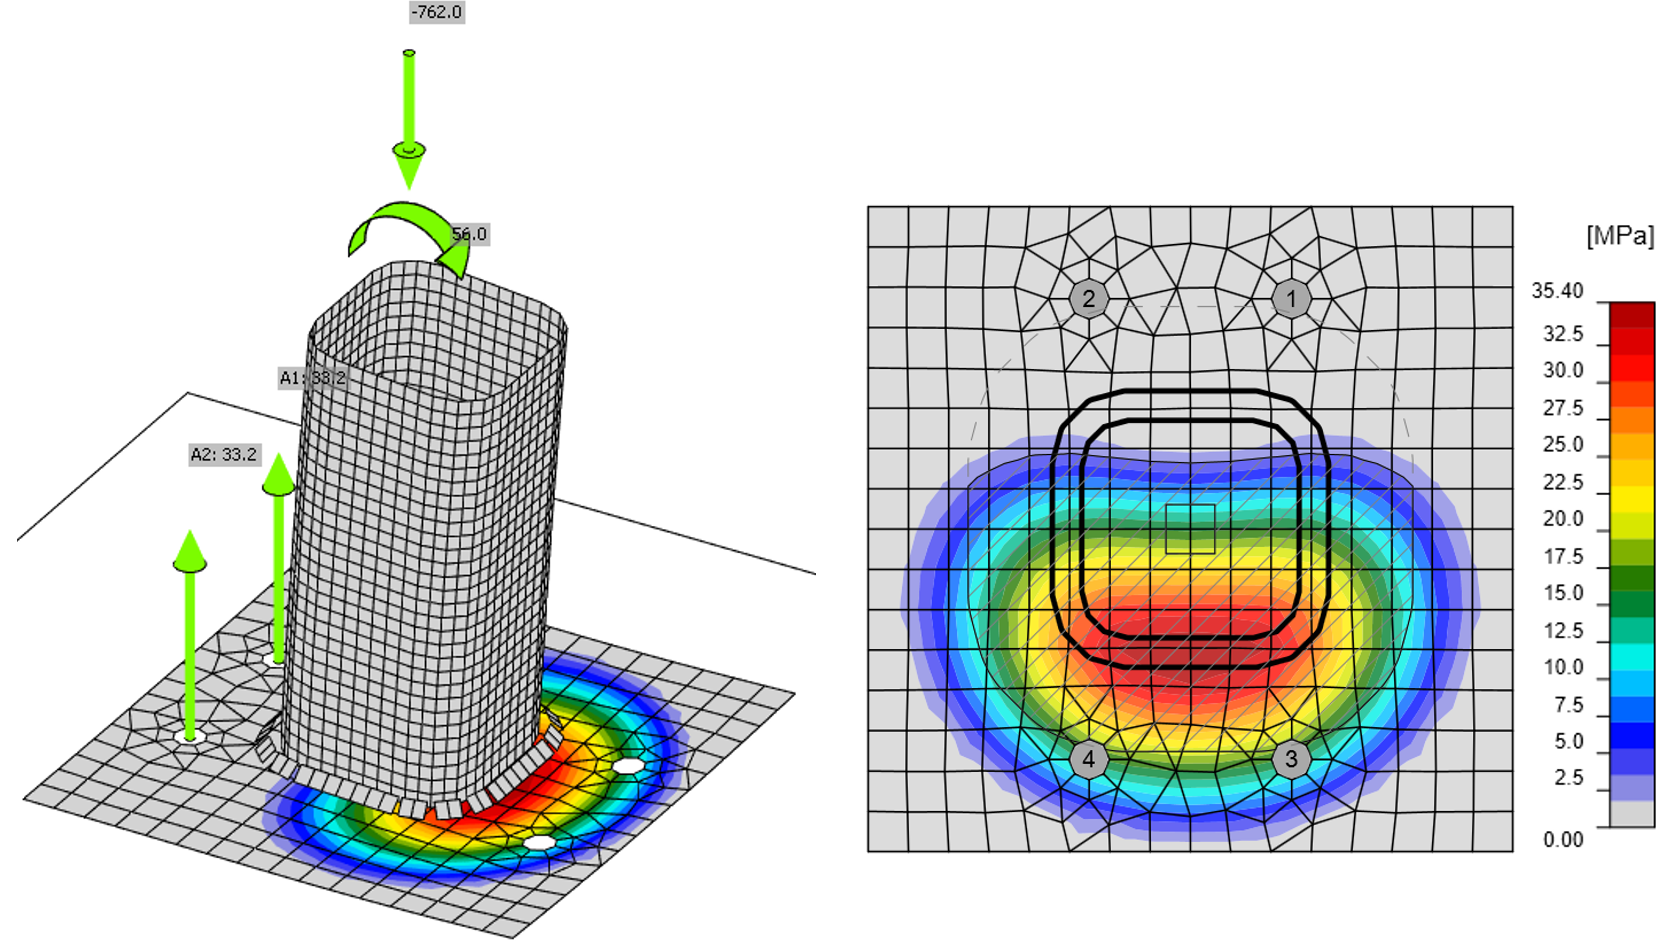
In CBFEM, the prying forces occur in the case of loading in pure tension loading; while in CM, no prying forces are developed by limiting the resistance to 1-2 failure mode only; see (Wald et al. 2008). Due to the prying forces, the difference in resistance is about 10 %. The numerical model of the column base is shown in Fig. 8.4.2. Results by CBFEM are presented by the bearing stress distribution on concrete for points 0 and 3, displayed in Fig. 8.4.3 and Fig. 8.4.4, and compared on the interaction diagram in Fig. 8.4.5.
Fig. 8.4.3 CBFEM results for point 0, i.e. pure bending moment
Fig. 8.4.4 CBFEM results for point 3, i.e. compressive force and bending moment
Fig. 8.4.5 Comparison of results of prediction of resistance by CBFEM and CM on interaction diagram for column base of column cross-section SHS 150×16
Sensitivity study
The sensitivity study is prepared for the column cross-section size, dimensions of the base plate, concrete grade, and dimensions of the concrete block. The columns are selected SHS 150×16, SHS 160×12.5, and SHS 200×16. The base plate is designed with area dimensions 100 mm, 150 mm, and 200 mm larger than the column cross-section. The base plate thickness is 10 mm, 20 mm, and 30 mm. The foundation block is from concrete grade C20/25, C25/30, C30/37, and C35/45 with a height for all cases 800 mm and with area dimensions 100 mm, 200 mm, 300 mm, and 500 mm larger than the dimensions of the base plate. One parameter was changed while the others were held constant. The parameters are summarized in Tab. 8.4.1. The fillet welds with thickness a = 12 mm were selected. The joint coefficient for grout with sufficient quality is taken as βj = 0,67. Steel plates are from S420 with anchor bolts M20 grade 8.8 with embedment depth 300 mm in all cases.
Table 8.4.1 Selected parameters
| Column cross section | SHS 150×16 | SHS 16×12,5 | SHS 200×16 |
| Base plate offset, mm | 100 | 150 | 200 |
| Base plate thickness, mm | 10 | 20 | 30 |
| Concrete grade | C20/25 | C30/37 | C35/45 |
| Concrete pad offset, mm | 100 | 300 | 500 |
For the sensitivity study of column cross-section, the concrete grade C20/25, the base plate thickness 20 mm, the base plate offset 100 mm, and the concrete block offset 200 mm were used for varying parameters of the column section. The comparison of CBFEM to the analytical model by CM is shown in the interaction diagrams in Fig. 8.4.6.
Fig. 8.4.6 Comparison of results of CBFEM to CM for the different column cross-sections
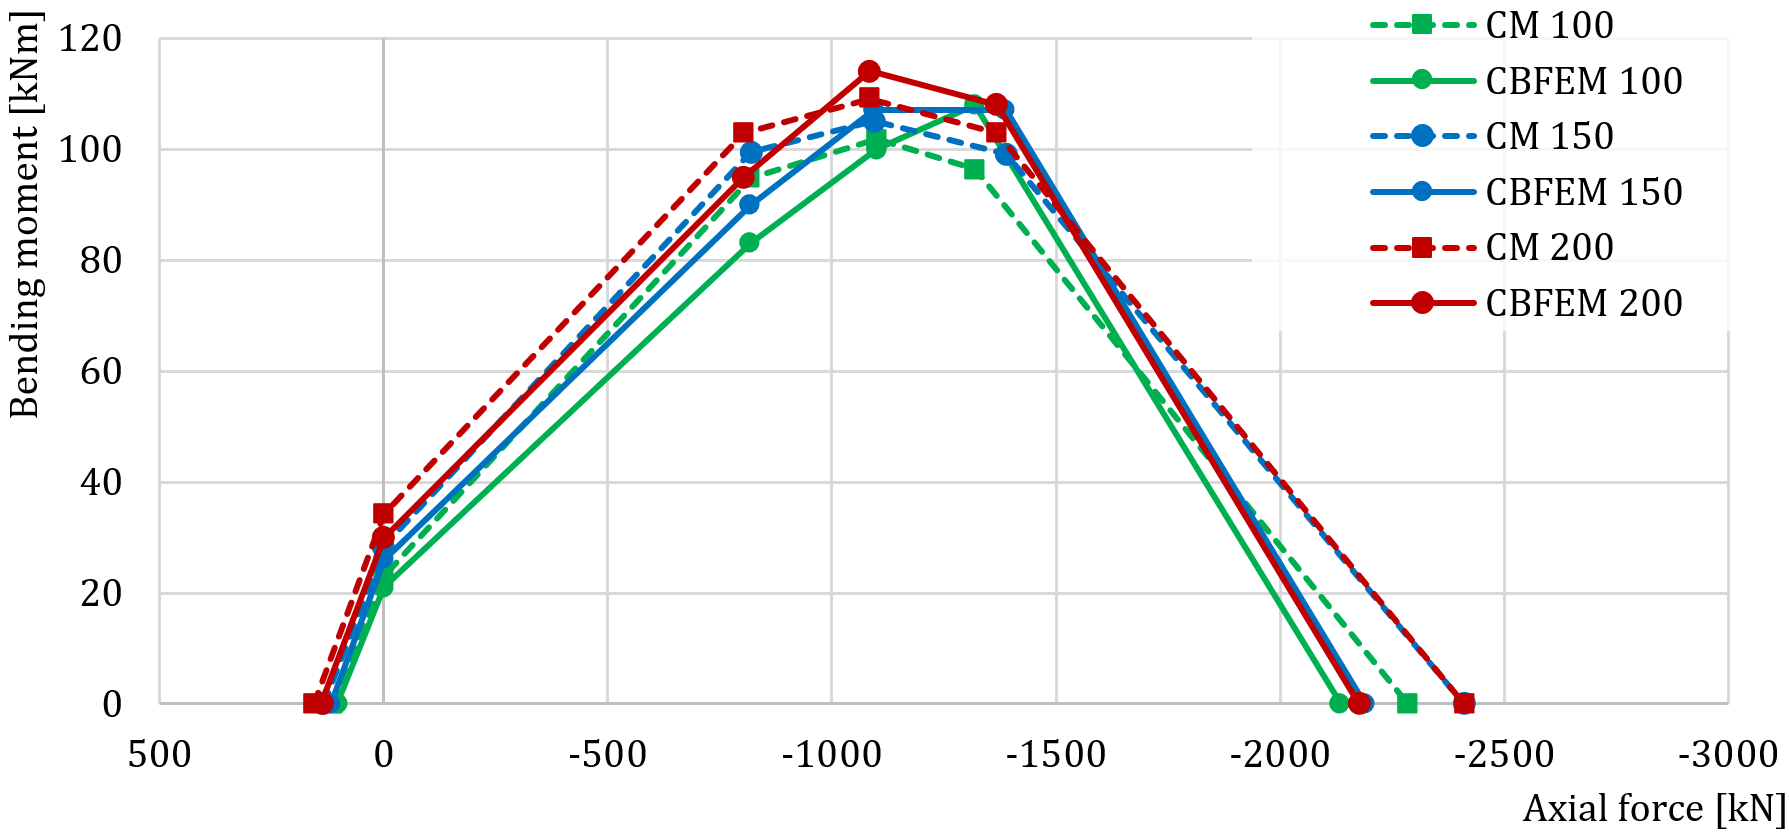
For the sensitivity study of base plate offset, the column cross-section SHS 200×16, concrete grade C25/30, base plate thickness 20 mm, and concrete block offset 200 mm were selected. The comparison of interaction diagrams is in Fig. 8.4.7. The most significant difference is in the resistance in pure tension of a large base plate where significant prying forces were present in CBFEM analyses, which are limited by analytical design.
Fig. 8.4.7 Comparison of results of CBFEM to CM for the different base plate offsets
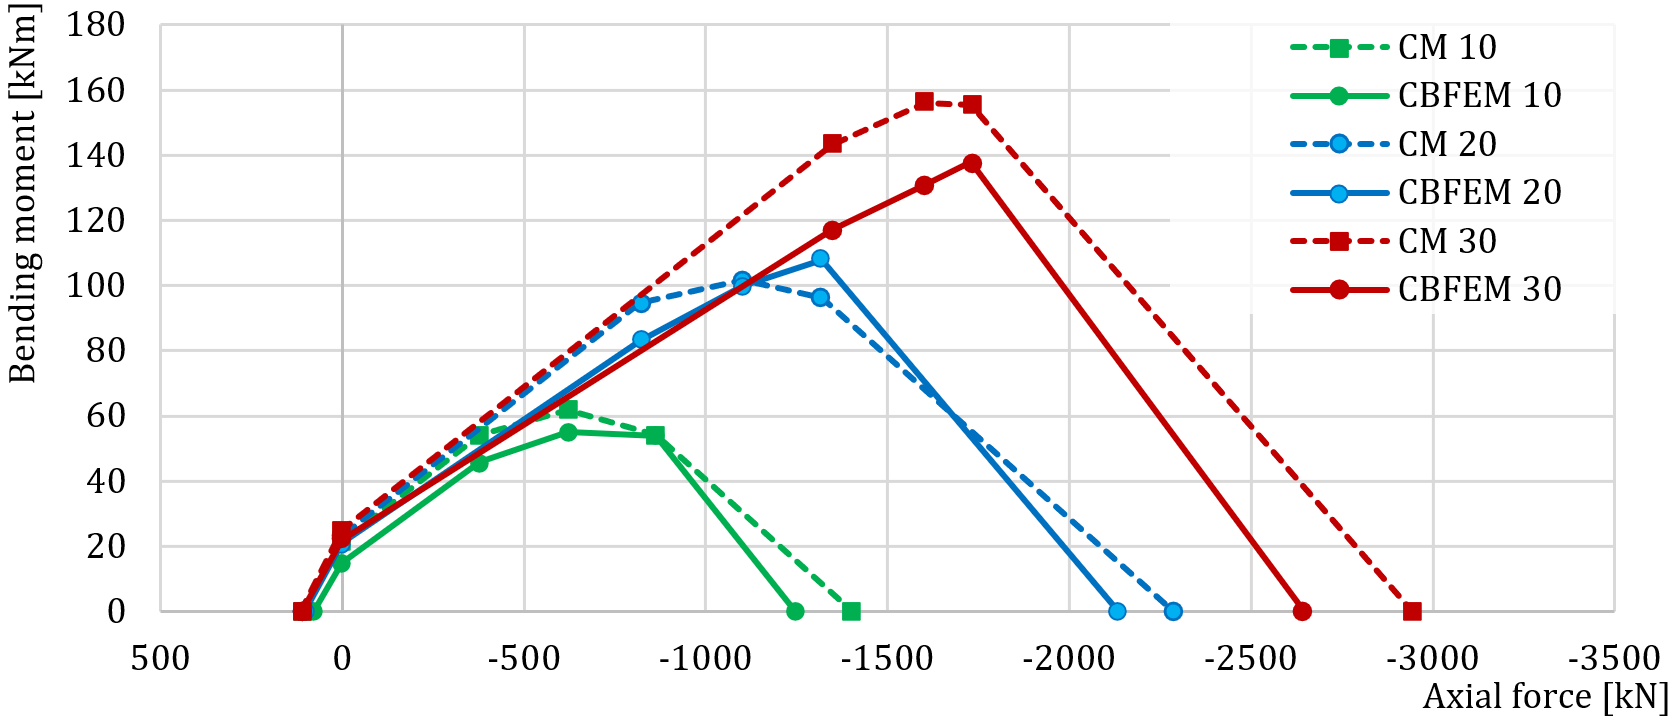
For sensitivity study of base plate thickness, the column cross-section SHS 200×16, concrete grade C25/30, base plate offset 100 mm, and concrete block offset 200 mm were selected. 10 mm, 20 mm, and 30 mm base plate thicknesses were used in this study. The comparison of interaction diagrams is in Fig. 8.4.8. The biggest difference is in the resistance in pure tension of a thin base plate where significant prying forces were present in CBFEM analyses, which are limited in analytical design by CM.
Fig. 8.4.8 Comparison of results of CBFEM to CM for the different base plate thickness
For the sensitivity study of concrete grade, the column cross-section SHS 150×16, base plate thickness 20 mm, base plate offset 100 mm, and concrete block offset 200 mm were selected. Concrete grades C20/25, C30/37, and C35/45 were used in this study. The comparison of interaction diagrams is in Fig. 8.4.9.
Fig. 8.4.9 Comparison of results of CBFEM to CM for the different concrete grades
For the sensitivity study of concrete block offset, the column cross-section SHS 160×12.5, base plate thickness 20 mm, base plate offset 100 mm, and concrete grade C25/30 were selected. 100 mm, 300 mm, and 500 mm concrete block offsets were used in this study. The comparison of interaction diagrams is in Fig. 8.4.10.
Fig. 8.4.10 Comparison of results of CBFEM to CM for the different concrete block offsets
The differences in the prediction of resistance of column base by CBFEM and CM are mainly in accepting the prying forces in CBFEM and avoiding it by CM according to EN 1993-1-8:2005.
Tab. 8.4.2 Interaction diagram comparison of CBFEM and CM
| Difference CBFEM/CM | Point -1 | Point 0 | Point 1 | Point 2 | Point 3 | Point 4 |
| Maximum % | 100% | 105% | 107% | 105% | 112% | 93% |
| Minimum % | 69% | 71% | 81% | 84% | 89% | 88% |
Benchmark case
Input
Column cross-section
- SHS 150×16
- Steel S420
Base plate
- Thickness 20 mm
- Offsets at top 100 mm, left 100 mm
- Welds – butt welds
- Steel S420
Anchors
- M20 8.8.
- Anchoring length 300 mm
- Anchor type: Washer plate - circular; size 40mm
- Offsets top layers 50 mm, left layers −20 mm
- Shear plane in thread
Foundation block
- Concrete C20/25
- Offset 200 mm
- Depth 800 mm
- Shear force transfer friction
- Grout thickness 30 mm
Loading
- Axial force N = −762 kN
- Bending moment My = 56 kNm
Output
- Plates
- Anchor bolts 97,8 % (\(N_{Ed,g} = 65.7 \textrm{ kN} \le N_{Rd,c} = 67.2 \textrm{ kN}\) (critical component concrete cone breakout for group of anchors A1 and A2)
- Concrete block 91,5 % (\( \sigma = 24.5 \textrm{ MPa} \le f_{jd} = 26.8 \textrm{ MPa}\))
- Secant rotational stiffness \(S_{js} = 6.3 \textrm{ MNm/rad}\)
References
EN 1993-1-8, Eurocode 3, Design of steel structures – Part 1-8: Design of joints, CEN, Brussels, 2005.
Wald F. Column Bases, CTU Publishing House, Prague, 1995.
Wald F., Sokol Z., Steenhuis M., Jaspart, J.P. Component method for steel column bases, Heron, 53, 2008, 3-20.


